Sinai Health Financials
The following charts show the distribution of income and expenses for Sinai Health for 2025–2026.
Income ($000s)
(For the year ended March 31, 2026)

Ministry of Health and Ontario Health
Patient revenue
Research funding
Other revenue and recoveries
Interest income
Amortization of deferred contributions
Expenses ($000s)
(For the year ended March 31, 2026)

Salaries and benefits
Drugs and clinical supplies
Facilities operations and maintenance
General supplies and other
Amortization of property, plant and equipment
Interest expense
Sinai Health Foundation Financials
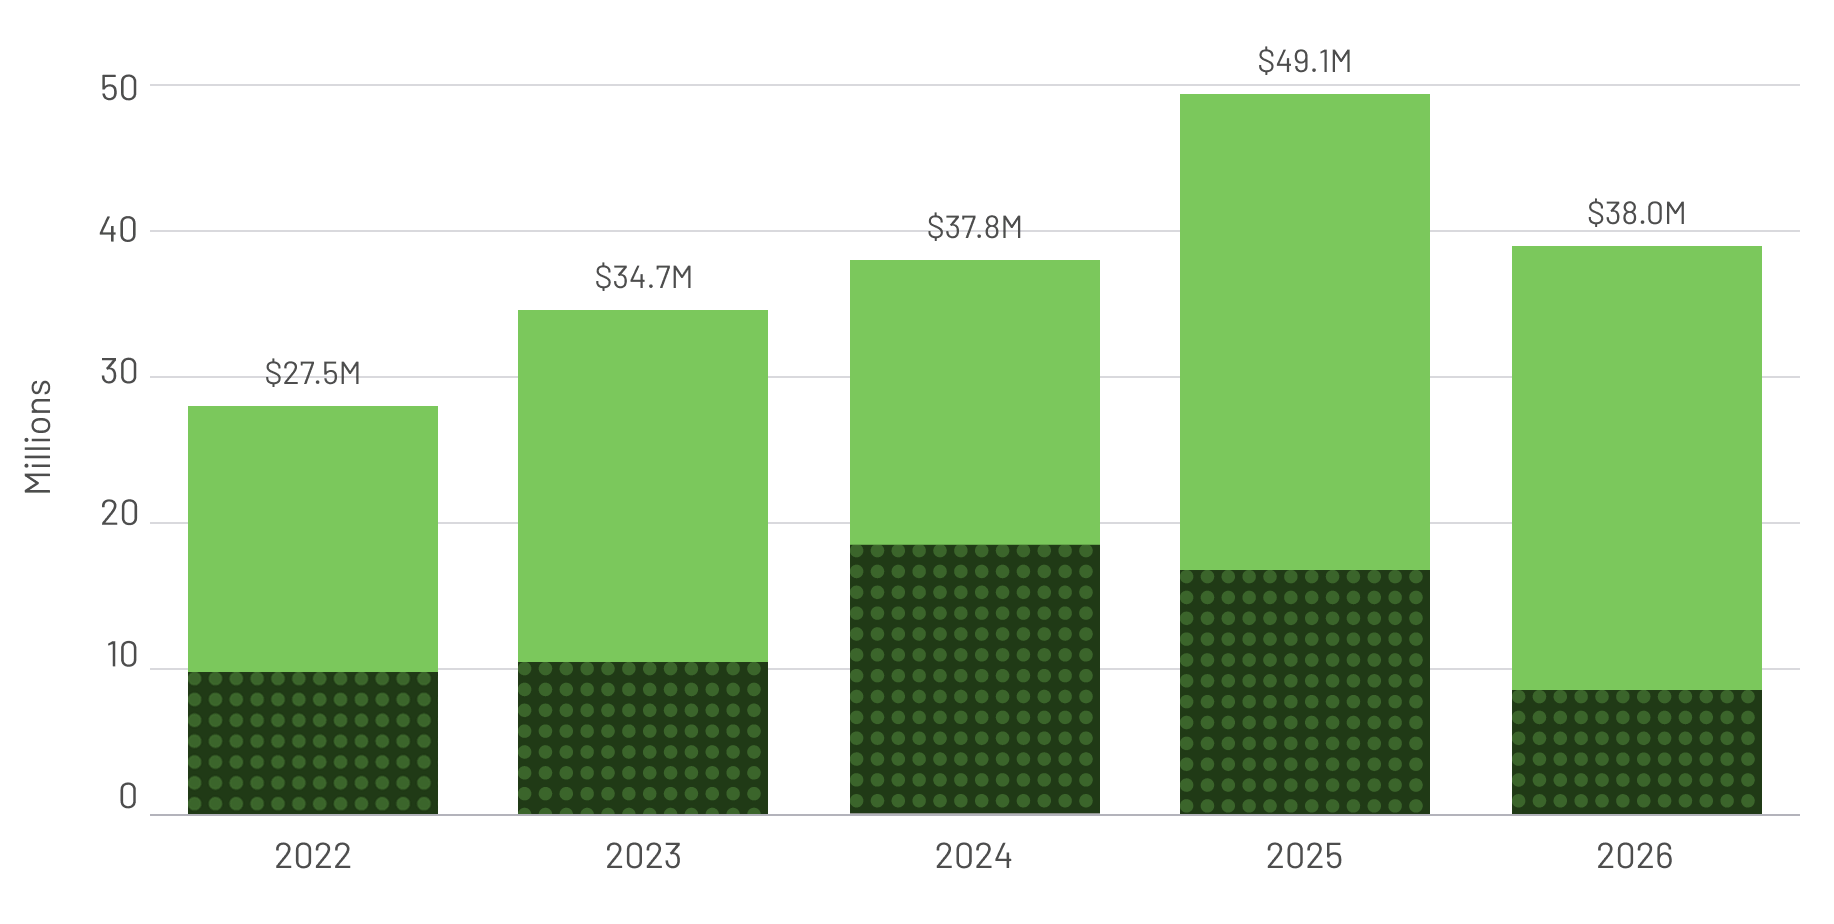
Total Revenue and Expenses

Revenue
Expenses
Fund Balances at Year-End

Endowed
Expendable Restricted and General Fund
Grants to Sinai Health System
Clinical and Research Grants
Capital Grants
We granted funds for capital, education, clinical care and research in:
Cancer
Diabetes
Digestive Diseases
Emergency Medicine
Digestive Diseases
Healthy Aging and Geriatrics
Highest Priority Needs
Lunenfeld-Tanenbaum Research Institute (Research)
Mature Women’s Health
Medical Imaging
Orthopedics and Sports Medicine
Pain Management
Palliative Care
Renew Sinai (Capital)
Science of Care (Nursing)
Surgery
Women’s and Infants’ Health